The Symfony web profiler panel#
To see which workflows a single request dispatched and what their journals
recorded so far, open the Durable panel of the web profiler. It belongs to gplanchat/durable-bundle
and appears wherever the web profiler is installed.
It is not the dashboard in a smaller frame. The dashboard lists the runs of an application; this panel lists the runs of one request, so it has no backend banner, no counters and no filters.
Screenshots#
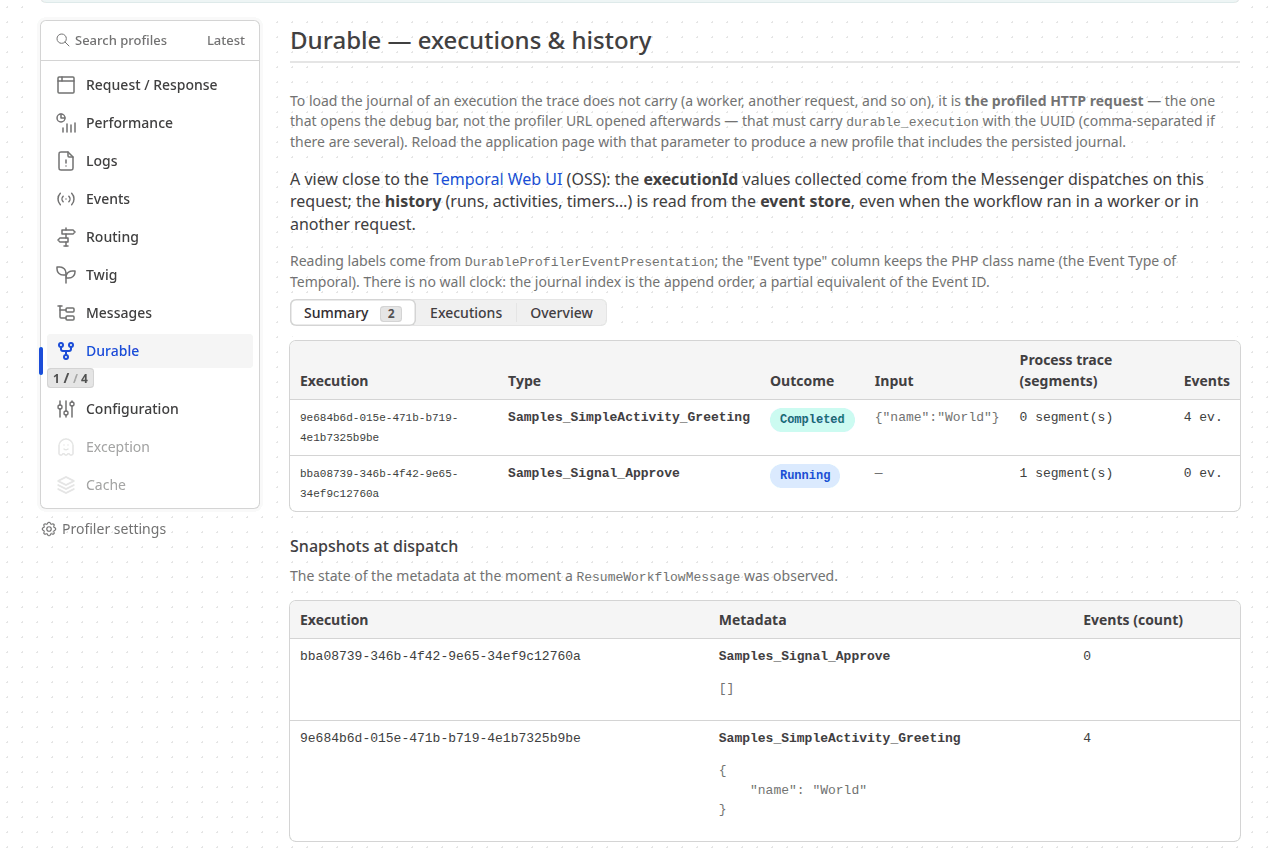
The Summary tab after a request that dispatched two workflows: one completed, one running with no event in its journal yet.
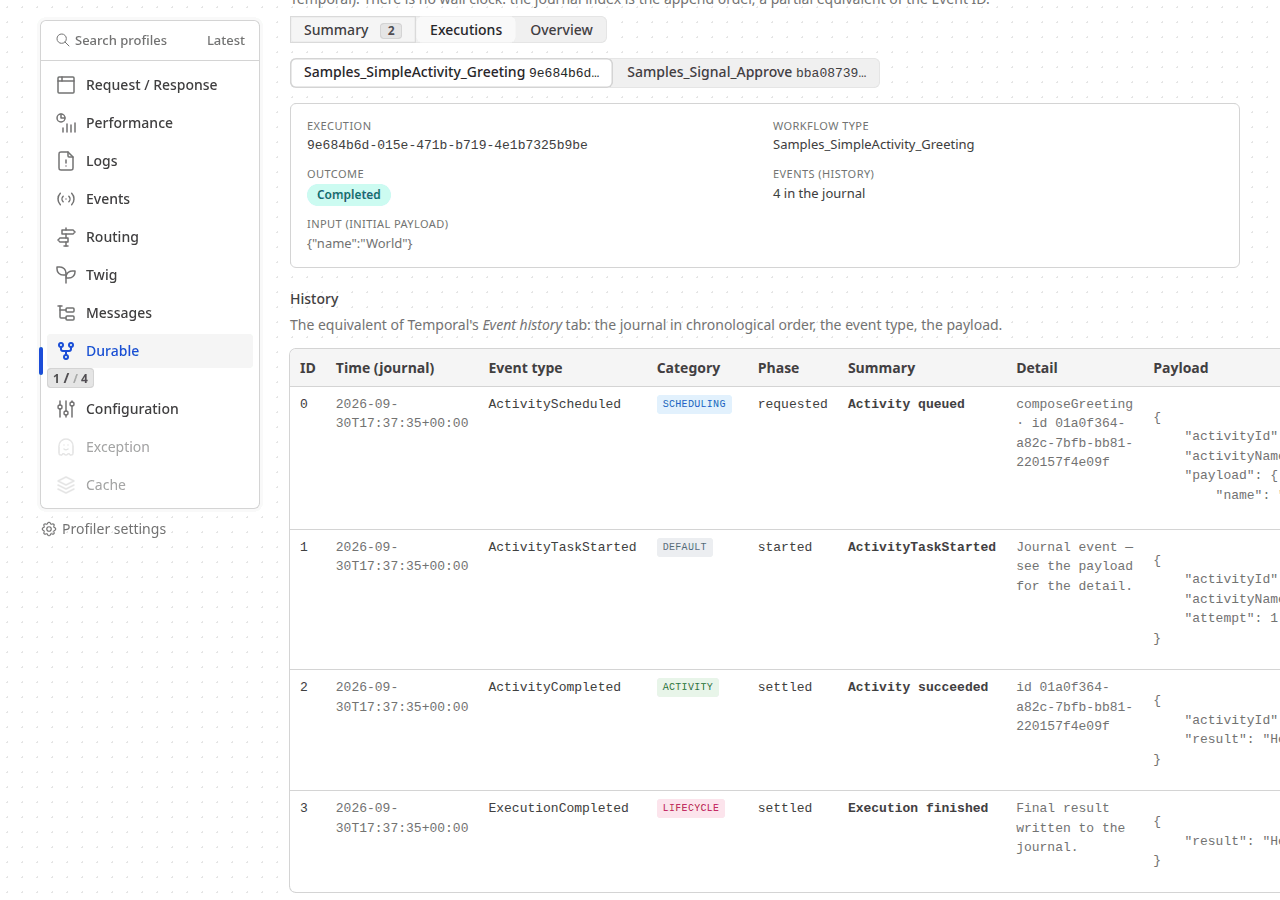
The Executions tab, open on the completed execution: its outcome, then its History, one row per journal event.
Open the panel#
- Load a page of your application that dispatches a workflow, with the debug toolbar enabled.
- Click the Durable item of the toolbar. It shows the number of dispatches and of journal events collected on the request.
- Read the Summary tab first: one row per execution, with its execution id, type, outcome and number of events.
The Executions tab opens each execution: its event history, its Nexus operations, its timeline and its process trace. The timeline is the one the run pages draw, with one line per action, the wait for a worker hatched and the failing interval in red (see Read a run). The process trace shows the time this process spent on the run during the request, which the journal does not record. The Overview tab draws every process on one time frame and lists the Messenger dispatches of the request.
Load a journal the request did not dispatch#
The panel collects the execution ids seen in the request’s process trace: the Messenger dispatches, and the workflows and activities run in the same process. To add
one that a worker or another request started, put durable_execution on the URL of the request
you profile, with the execution id, or several separated by commas:
https://shop.localhost/checkout?durable_execution=0195f3c2-7a1e-7d2a-9c1b-3f6a2e8b5d40The parameter goes on the profiled request itself, the one that fills the toolbar. Opening it on the profiler URL afterwards changes nothing. Reload the page with it to produce a new profile. A request reads at most 20 ids, and each id costs one journal read.
When the journal is empty#
If the request dispatched a message but the panel shows no event, the message is probably still
queued: with an asynchronous transport, the handler has not run in this process. The panel says
Journal still empty. Run a worker, then reload with durable_execution set.
What differs from the dashboard#
- Wording. The outcome column uses the words of the other dashboards, and adds three states that are not outcomes: Queued (no journal yet), Pending and Cancellation requested. The panel is in English only.
- Limits. 500 events per journal, and a warning when a Nexus operations table is cut.
Parity lists every difference.