Read a run#
To find out what happened to one execution, open its run page. Sylius, Magento and Filament draw the same page, with the chrome of their own admin. The web profiler panel shows the same facts in a different layout.
The header#
The header names the workflow, the execution id and the outcome: running, completed, failed, cancelled or continued as new. Two cases need a second look.
- Continued as new is a normal ending. The run handed over to a fresh execution and finished without error.
- Two ids. On Temporal, the execution id is the one your application knows, and the run id identifies one attempt on the backend. The three dashboards label the run id Backend run. Sylius and Filament print it beside the execution id, and Magento gives it its own line. The profiler does not show it.
A running run adds one line saying what it waits on, as of its last suspension:
waiting on timer "grace period" due at 2026-09-24T10:00:00+00:00,
waiting on activity charge attempt 2 in flight, or waiting on condition at src/…/OrderWorkflow.php:42.
A run that has been dispatched and not picked up says waiting for a worker instead, with the time
it has waited.
The timeline#
Each line is one action: an activity, a timer, a child workflow, a Nexus operation, a signal received. An activity that was scheduled, started and completed is one line. The first line is the run itself.
- The bar is the duration, placed where it happened, from the recorded time.
- A hatched stretch is a queue. The work had been asked for and nobody had started it. A run that spent 22 of its 24 seconds hatched was waiting for a worker.
- Red marks the event that failed. An activity that failed twice and then succeeded carries red and ends well. A cancellation is not red.
- The name on the row is the name of the activity, the child workflow or the operation. A timer is named by its delay. The run’s own line carries the workflow’s name. A long name wraps onto a second line.
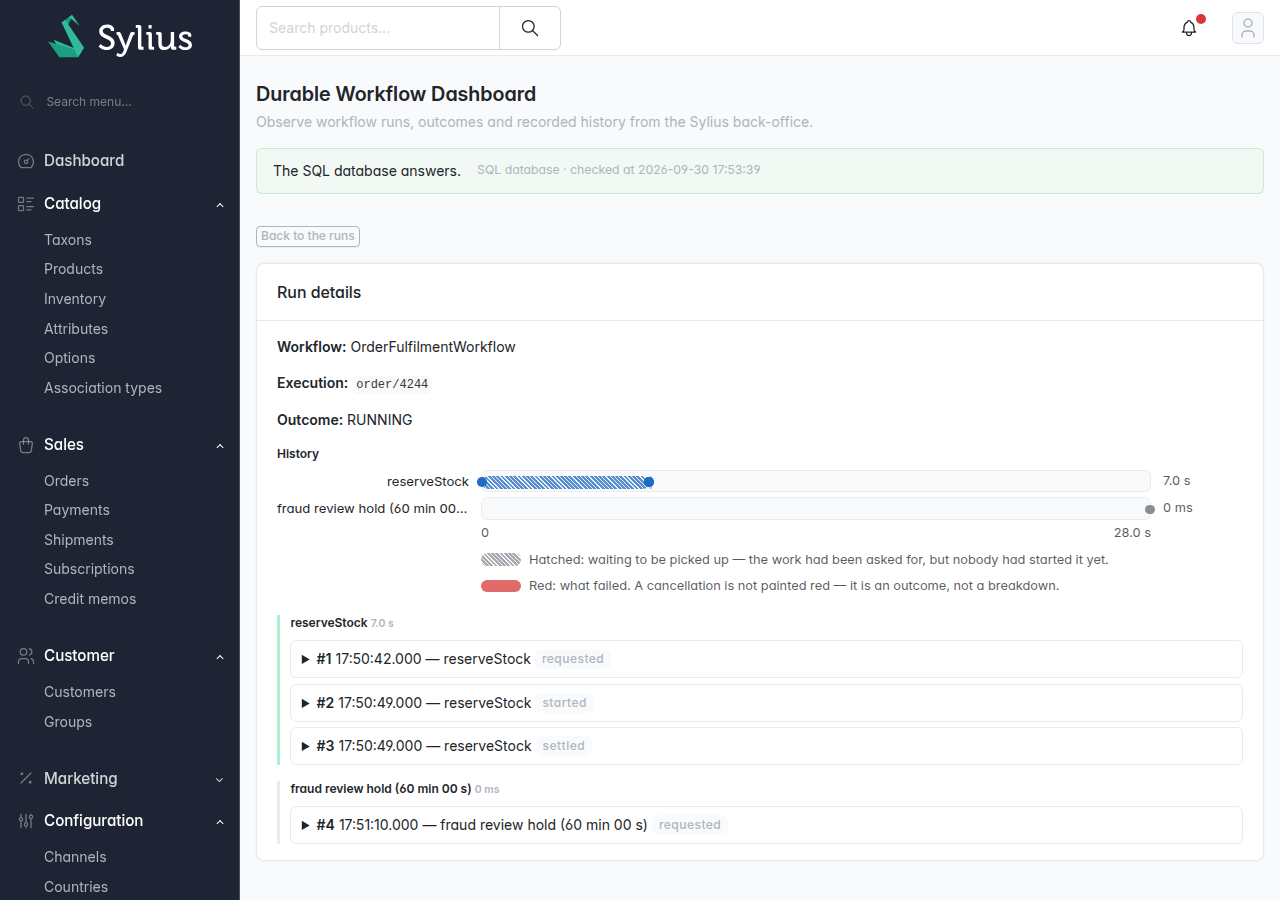
Order/4244 on Sylius. reserveStock waited in the queue before a worker picked it up (hatched); the timer has been set and has not fired.
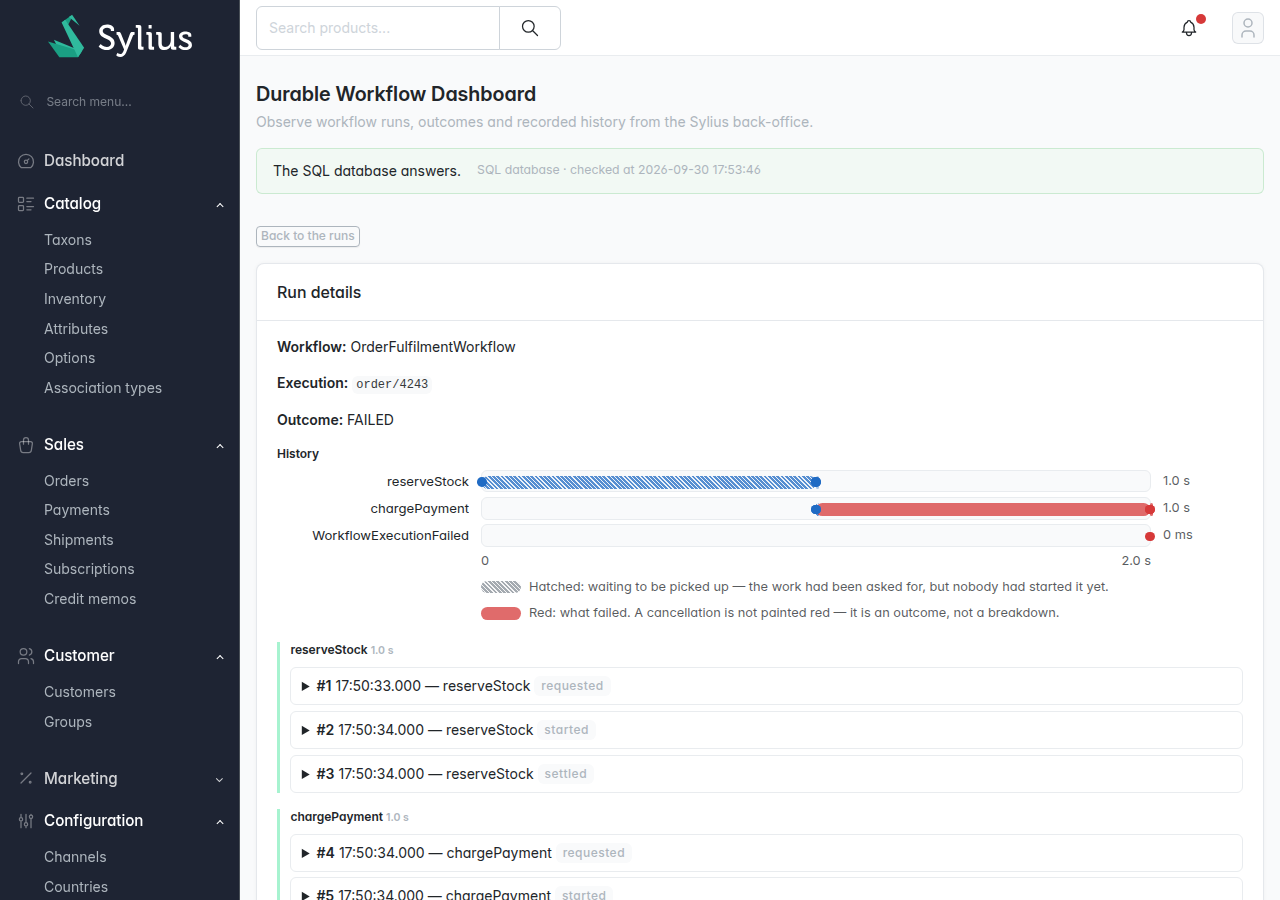
Order/4243 on Sylius. The event that failed is red, and the run ends as failed.
The web profiler draws the same timeline for each run of the request it profiles.
The events#
Under the timeline, each action lists its events with a phase: requested, started, failed or
settled. Click an event to unfold what the backend recorded with it: the arguments an activity was
called with, what it returned, the class and message of a failure. Values under keys such as
password, token, secret, authorization, card or api_key are replaced, and long strings
are cut. Personal data under other keys still shows, so treat the page as you would the journal.
An event with nothing recorded stays a plain line.
Nexus operations#
When the run called a Nexus operation, a table lists its endpoint, its service, its operation and its state: in flight, completed, failed, timed out or cancelled. An operation in flight is a wait served by another service, so the cause of a slow run may be there rather than in your code.
See also#
- A run does not progress starts from what the page says and goes to what to do
- Parity says which surface shows which of these